
Loading
Welcome to the B2B Trade Briefing, your monthly report on the credit and trade data shaping the physical goods economy.
Each month, we analyze millions of data points across the B2B trade lifecycle flowing through Nuvo's network of 150,000+ businesses, spanning onboarding, credit, AR, and payments, to surface benchmarks, patterns, and signals for credit and finance leaders to action against.
While most data surrounding B2B trade is outdated, anecdotal, or both, we aim to give you an honest read on what's happening in your industry (think: approval rates, fraud patterns, terms being extended, and where demand is moving) and to back it up with the numbers.
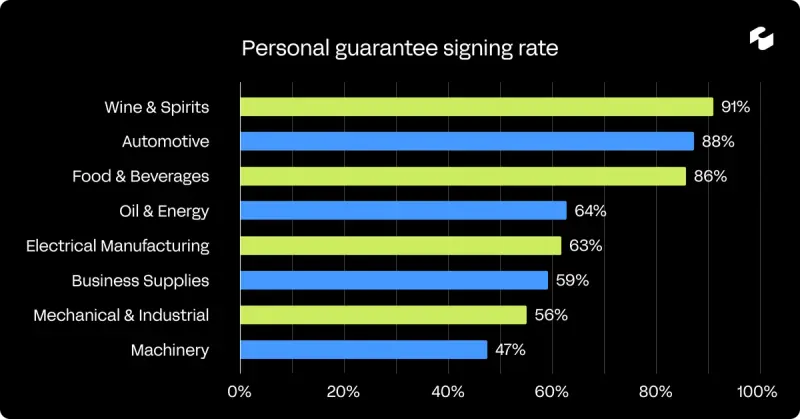
In April, 19% of buyers stopped filling out a credit application when presented with a personal guarantee request. This doesn’t necessarily mean that they’re unqualified, but it does point to hesitancy around increasing personal exposure on a business transaction.
The data reveals two key factors that help to predict whether a buyer will sign a personal guarantee: their industry and the size of the credit limit being extended.
Wine & Spirits leads the way with the highest percentage of personal guarantee signers at 91%. These rates aren’t necessarily driven by regulations, but by the range of customer sizes and vendor types that Wine & Spirits suppliers are selling into, including bars and restaurants, big box liquor stores, as well as smaller bodegas or corner stores.
As for the industries with the highest abandonment rates, Machinery buyers walk away 53% of the time. With half as many signing as in Wine & Spirits, that almost certainly reflects who's being asked to sign. Industrial machinery purchases tend to involve larger principals, often operating through LLCs or corporate structures where a personal guarantee is viewed as a serious legal commitment. A local wine bar signing for a $2K line is a different conversation than a machinery executive signing for $50K.
Buyers sign readily for small limits: 89% sign for limits in the $1K–$5K range. Cross $10K and the signing rate drops sharply, bottoming out around $25K–$50K at 66%.
If you’re a supplier, the takeaway isn’t that the PG step is uniformly costly. It's concentrated in specific industries and credit limit amounts. Suppliers extending credit to industrial buyers above $10K are accepting the highest abandonment risk. Whether that tradeoff is worth it depends on the deal, but knowing where the friction lives is the first step to deciding whether to structure around it.
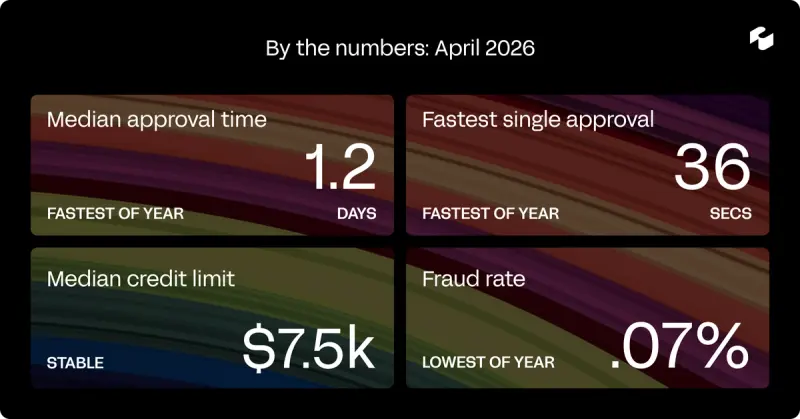
Median approval time dropped to 1.2 days in April, the fastest of the year and an amazing feat in a space where application approval timelines can sometimes drag on for weeks. Behind that number, average application approval time has fallen 52% since the start of the year.
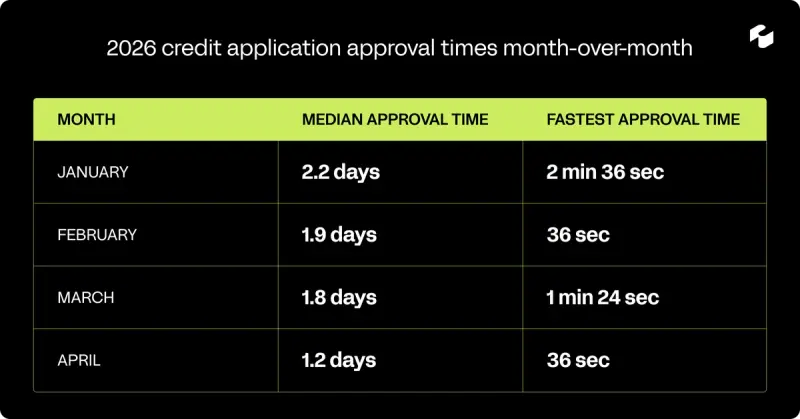
The fastest approvals aren't random. Virtually all of the sub-five-minute decisions on the platform come from teams that have configured automated decisioning workflows, powered by Nuvo Intelligence—and the 36-second approval this month reflects one of those setups: With agents working on your behalf, you can make an informed credit decision executed faster than most people can read an application.
The median credit limit granted in April held at $7,500, unchanged since February. So this month, we looked into what determines whether a buyer lands in the top 10% of limits (above $50,000) versus the middle of the pack.
It's not application completeness—top-tier applicants complete roughly the same number of steps as everyone else. The differentiators are documentation depth and buyer profile:
Buyers who received limits above $50K came with an average of 2.5 trade references versus 1.7 for the rest, a 49% gap. In a process where suppliers are trying to build a picture of a buyer's creditworthiness, more references means more signal. The data suggests suppliers are rewarding that.
Counter-intuitively, high-limit buyers are less likely to use instant bank verification (19% vs. 31%) and more likely to submit a manual bank reference (63% vs. 35%). This is probably a buyer profile story more than a preference story: large commercial buyers, the kind placing $50K+ orders, often have business banking relationships and AP workflows that predate modern connectivity tools. Unlike smaller businesses, their lasting relationships and tenure with their banks makes acquiring traditional bank reference requests on a timeline feasible.
Importantly, all of these higher limits include banking information of some kind.
Mining and metals, packaging, building materials, machinery, and construction are all significantly overrepresented among the highest credit limits. Wholesale, retail, and food & beverage skew toward the smaller end. Some of that reflects deal size, of course, but it also reflects the documentation culture that comes with heavy industrial procurement.
The practical takeaway for buyers: the path to a higher credit limit runs through references and bank documentation. A fuller package with more references shows suppliers you’re serious and trustworthy.
Fraud-flagged application volume fell to its lowest level of the year in April, with an attempted fraud rate of just 0.07%, down 73% from January.
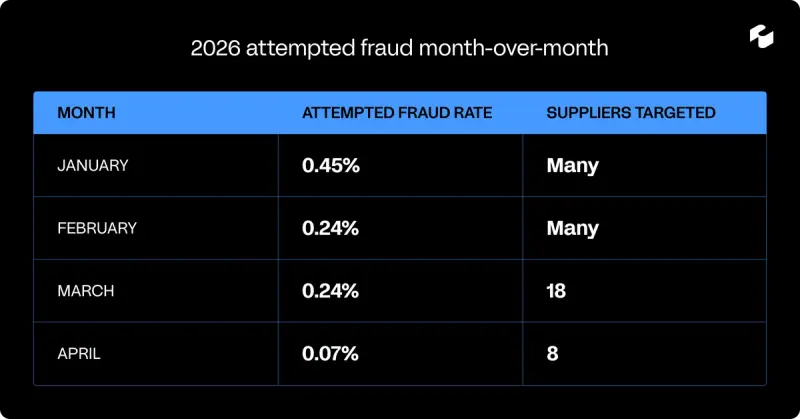
Through January and February, the same individuals were showing up repeatedly across multiple suppliers, which showed a pattern consistent with organized fraud rings probing for weak points in different credit workflows. Those actors are absent from April's data entirely. Nuvo Intelligence helps suppliers identify fraud by flagging suspicious applications and activity, and the network effect created on the platform helps identify bad actors sooner rather than later.
Electrical and solar supply distribution continues to be the most-targeted segment, a pattern that has now held across all four months of the year. This makes sense: High-value components, distributed purchasing, and the growth of new entrants in the solar supply chain create the conditions that fraud actors look for. Suppliers in this vertical should maintain elevated review protocols regardless of where the headline fraud rate lands.
This report is based on anonymized, aggregated data from across the B2B trade lifecycle flowing through Nuvo's network of 150,000+ businesses. All figures reflect network-wide trends we're seeing spanning onboarding, credit, AR, and payments from the Nuvo platform.