

Loading
Welcome to the B2B Trade Briefing, your monthly report on the credit and trade data shaping the physical goods economy.
Each month, we analyze millions of data points across the B2B trade lifecycle flowing through Nuvo's network of 150,000+ businesses, spanning onboarding, credit, AR, and payments, to surface benchmarks, patterns, and signals for credit and finance leaders to action against.
While most data surrounding B2B trade is outdated, anecdotal, or both, we aim to give you an honest read on what’s happening in your industry (think: approval rates, fraud patterns, terms being extended, and where demand is moving) and to back it up with the numbers.
March saw significant application growth broad-based across industries.
Consumer Goods (+239%), Food Production (+222%), and Apparel/Fashion (+142%) all posted triple-digit growth from January to March. Wholesale (+111%) and Packaging & Containers (+101%) crossed the 100% threshold as well. Transportation rounded out the fastest-growing cohort at +121%.
Q1's growth story doesn't just belong to one industry, and there’s probably a couple of reasons for that.
One is a macro consideration: There is still a level of tariff uncertainty throughout the supply chain. As recently as last week, plans to increase tariffs on pharmaceuticals were announced, as well as a potential overhaul on existing steel and aluminum tariffs. An increase in orders could simply show businesses trying to transact before their industry experiences more disruption.
The other reason likely has more to do with running business-as-usual: January is typically a slow month for B2B procurement as budgets finalize at the end of the year prior. Purchasing decisions made in December often don’t turn into formal credit applications until February or March.
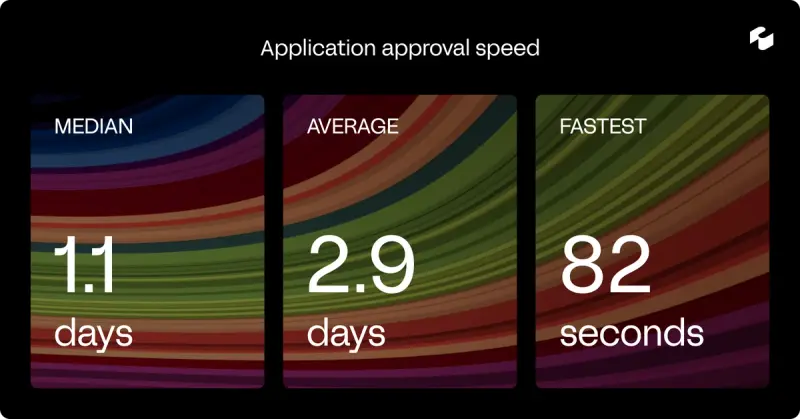
Across a sample of around 10,000 applications, the median approval time was 1.1 days with the average standing at 2.9 days. This means the majority of applicants received a decision within just 24 hours, a stark contrast from the typical 7–14 day timeline you see in B2B.
A note on speed: The fastest approvals on the network came in at under 2 minutes, with the quickest decision closing in a mere 82 seconds.
The fastest approvers share a common trait: They’ve handed a part of the decision to machines. Nuvo Intelligence is agentic, meaning it can reason through an application and act on it autonomously, making it able to compress what used to take days into something that takes seconds.
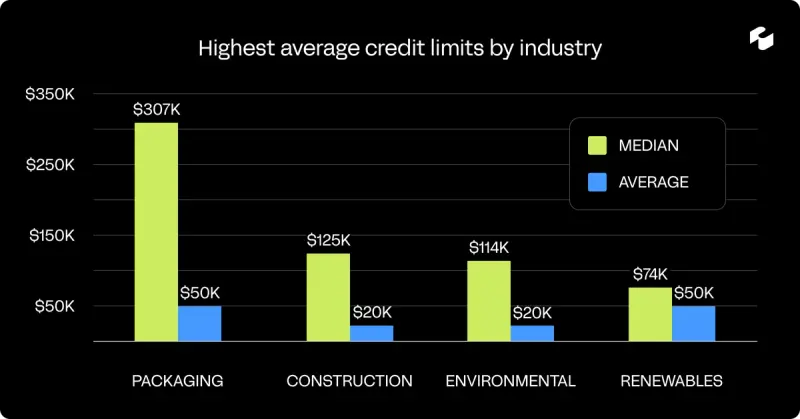
The average credit limit extended across the Nuvo Network in March was $25,148, with a median of $7,000. This is a significant spread that reflects the wide range of buyer profiles and industries in the network. We’ll continue to track this number month over month and report on how it’s changing.
But for now, breaking it down by industry tells a more nuanced story:
Highest average limits (pictured above):
Highest volume, more modest limits:
Lowest average limits:
When benchmarking against industry averages, the median is almost always the more honest number. In industries like Packaging & Containers, where the average ($307K) is six times the median ($50K), a small number of very large accounts are pulling the mean far from reality. But it may also reflect recent news in the world of containerboard.
After going through a historic supply contraction last year, the sector lost roughly 10% of North American production capacity. This led analysts to predict a price hike in 2026, which has manifested with both Packaging Corporation of America and International Paper announcing $70 per ton price increases effective on March 1. This could be a plausible explanation for why Packaging & Containers is showing both the highest average credit limits on the network and the widest average-to-median gap: the big buyers are getting bigger lines to prepare for a tightening market.
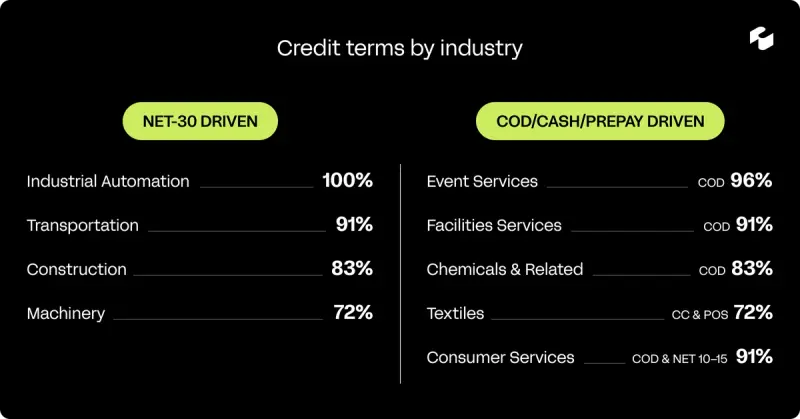
Credit terms vary significantly by industry, and the data reveals more than just an assumption of good will between parties.
Industries at the top of the Net 30 list tend to share a common profile: established buyer-seller relationships, large transaction sizes, and long procurement cycles where requiring upfront payment simply isn't practical. You don't ask a contractor to pay COD on a $125K order.
The COD-heavy end of the spectrum is more interesting. Events Services at 96% COD shows a reflection of an industry built on one-time or infrequent transactions where there's rarely enough relationship history to justify extending credit versus risk management failures.
The data is particularly interesting when you dig into Consumer Services, which is split almost evenly between COD and Net 10–15. The macro backdrop here may offer some context.
Consumer confidence data from March 2026 shows spending plans fell across nearly every service category as rising costs weigh on households. For suppliers, that demand uncertainty makes the credit extension decision harder: Tighten terms and lose buyers or extend credit into a softening market?
B2B credit fraud is shifting, and the pattern is worth paying attention to. Through early 2026, fraud researchers have flagged a move toward AI-assisted synthetic identities engineered to behave like legitimate businesses: fewer attempts, better disguised, harder to catch.
The shape of attacks has changed in two meaningful ways:
Electrical and industrial suppliers remain among the most targeted segments, though the broadening distribution means no category should consider itself insulated.
For credit teams, the practical implication is that human review alone is an increasingly difficult line of defense. The red flags that used to be catchable (mismatched domains, inconsistent business details, obvious template language) are being engineered out. Teams relying on manual inspection at submission are the ones most exposed.
This report is based on anonymized, aggregated data from across the B2B trade lifecycle flowing through Nuvo’s network of 150,000+ businesses. All figures reflect network-wide trends we’re seeing spanning onboarding, credit, AR, and payments from the Nuvo platform.